Visualizing Metrics
App Metrics does not include any visualzation tool but does include generic Grafana dashboards for web applications which will get you started with the default metrics measured by App Metrics Middleware. There are also Sample Applications, each with a ready-to-go Grafana dashboards to help you get started.
The sample console application is configured to report metrics to InfluxDB, with metrics persisted in InfluxDB, Grafana can be used to visualize and alert on metrics. Below is a Grafana dashbaord showing some of the metrics recorded by the sample console application.
Tip
You can find App Metrics compatible Grafana dashboards on Grafana Labs.
Grafana Dashboards
InfluxDB Demo Dashboard

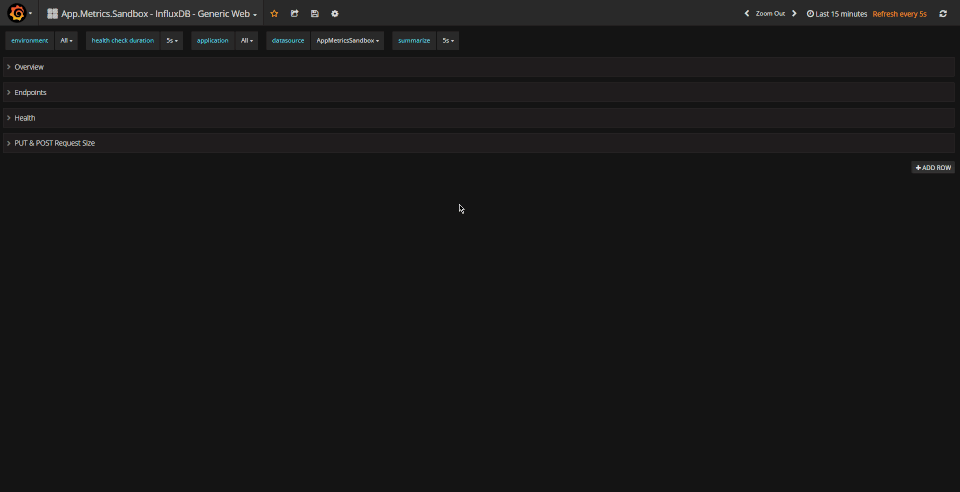
Web Monitoring
Generic web application dashboard, read the details here.
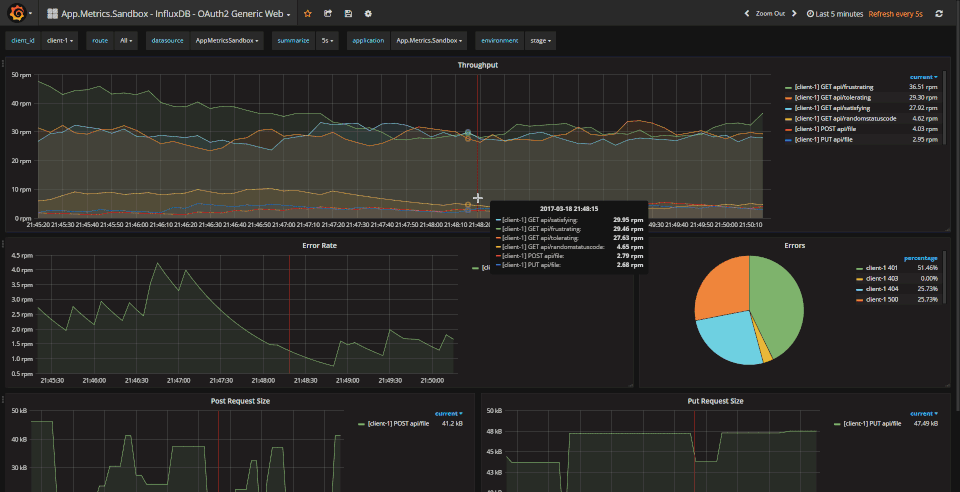
OAuth2 Web Monitoring
Generic OAuth2 client tracking dashboard, read the details here.